1 Hands-on: basic transformations
1.1 Getting Started
We’ll use a subset4 of Raleigh Building Permits data
- Launch the Open-Refine icon from your computer (find and double-click the jewel icon.)
- Installations / Start / Stop instructions
- Owen Stephens’s helpful video illustrating installation
- Remember: The User Interface for Refine is Chrome or Firefox
- If your default browser is one of these, Refine will auto-launch to http://127.0.0.1:3333
- If your default browser is IE, you’ll need to open the following URL http://127.0.0.1:3333 in Chrome or Firefox
-
https://raw.githubusercontent.com/libjohn/openrefine/master/data/subset-RBP-narrow.csv
- Click
- Select: Columns are separated by “commas (CSV)”
- Change the Project Name to
Raleigh Building Permitsand click Create Project >> (top-right)
1.2 Shutting Down OpenRefine
It’s IMPORTANT to properly shutdown the application. OpenRefine will automatically save your project as you transform your data. However, in my experience your last operation may have to be manually saved by following the procedures below…
Windows: Control-C Mac: Click the OR app in the doc, invoke Quit
NOTE: It is possible, but not guaranteed, to lose data if you don’t follow the rather unintuitive shutdown procedures. Better safe than sorry.
1.3 Facets & Cluster
Facet & Cluster
Goal 1: Create a facet of authorized work. Cluster & Merge types of authorized work.
- How many rows are in this dataset?
21,982 rows
- Slide the bottom column navigation bar to the right
- find the authorized_work column
- click the column header:
- How many facets are there?
7633 choices
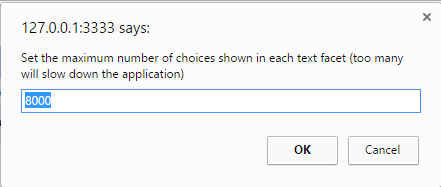
- You may see a program warning, a dialog-box error message screen shot prompting you to set the maximum number of choices show in the text facet. If so, accept the default and proceed.
- In the Facet box, click
count.- What is the 4th most popular type of authorized work?
SCREEN PORCH
- How many permits are recorded?
233
- To find spelling clusters, click the
Clusterbutton in the facet box - Click the
Select Allbutton, then theMerge Selected & Re-Clusterbutton, to merge all terms (accepting the default: Method = “key collision” ; Keying Function = “fingerprint”) - Repeat previous step using the “ngram-fingerprint” Keying Function, then close the Cluster & Edit dialog box
- How many SCREEN PORCH facets now exist?
238 - Compare to your answer in #4 above
Compound Facets
- Select the DECK Facet.
- How many matching rows match the Deck Facet?
340 matching rows
- Select the SCREEN PORCH facet combined with the DECK Facet. (Hover your mouse over the facet, click
include)- Now how many matching rows exist?
578 matching rows
- On the “land_use_code” column, make a text facet and limit to “SINGLE FAMILY”
- On the “county” column, make a text facet and limit to Durham County (DURH)
- How many “Single Family” homes received permits in Durham County for Screen Porches or Decks?
3
- Is the authorized work for Screen Porches, Decks, or both?
both
- Click the “Remove All” button to remove all text facets.
- How many matching rows are in the dataset now?
21,982
Mass Editing
It’s important to understand OpenRefine was designed to transform data in bulk. It is possible to edit single data cells but it is not as convenient as some other, more WYSWIG, tools. This exercise will help you learn how to accomplish these kinds of mass data transformations
- Make a Text facet on the work_type_description column
- There are two facets for new buildings: “NEW BUILDING” and “New Building”.
- How many “NEW BUILDING” rows exist? (click to reveal answer)
3 matching rows
- how many “New Building” rows exist?
9,668 matching rows
- Select “NEW BUILDING” facet, limiting to 3 matching rows. To the right of the “NEW BUILDING” facet, hover your mouse over the “edit” feature; click “edit” and alter the text to title case: “New Building” ; click Apply
- How many “New Building” rows exist now?
9,671 matching rows
- Mass edit “OTHER” & “Other” so they have the same value
- Mass edit “ALTERATIONS/REPAIRS” and “Alterations/repairs” so they have the same value
- Click “Remove All” to remove the facet window
1.4 Split data in cells
-
- Separator =
(> OK
- Separator =
-
- Separator =
,(i.e. accept default and click) > OK
- Separator =
-
latitude
-
longitude
(more data transformation could be done, but let’s move on for now…)
1.5 Concatenate cells together
-
- New column name =
Full Description - Expression =
value + cells["proposed_work"].value
- New column name =
The last step adds two columns together, but the preview screen is hard to read. Make it readable by using the next expression instead …
- Expression =
value + " sq ft. " + cells["proposed_work"].value> OK
1.6 Search & Replace, Plus More
Looking at the latitude and longitude cells, one column appears in green text (indicating OpenRefine considers data those cells as numbers) and one column appears in black with a closing parenthesis in the last position. Convert both columns to text, trim leading and trailing spaces, and then find and replace the parenthesis
Convert Data Types
Remove Whitespace
Search & Replace
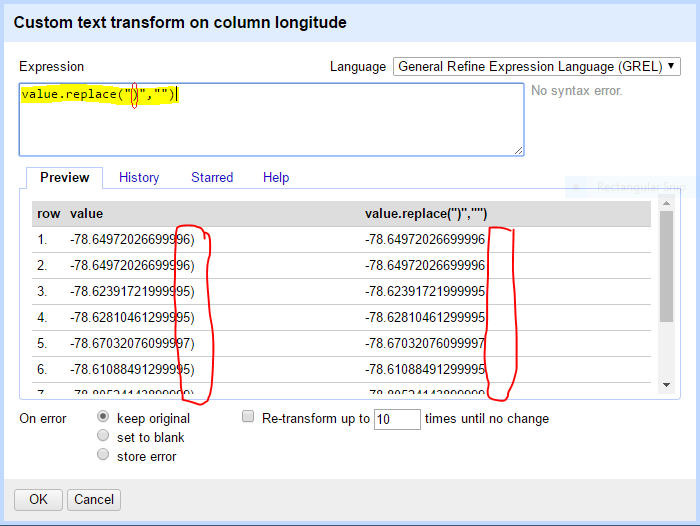
Search and Replace is commonly performed as a data transformation using the following function: value.search("old text","new text"). In the example below we replace a closing parenthesis with nothing, effectively removing the trailing parenthesis. The example may appear strange since the replace function exists within a set of parenthesis. Remember the text you are replacing is idnetified within the first set of quotation marks You will identify as the replacing text within the second set of quotation marks. I’ve draw red circles around the function, as well as the before and after text preview to clarify how the process will work.
-
- Expression =
value.replace(")","")
- Expression =
1.7 Web Scraping
Select a subset
We want to gather the FIPS code for a subset of the data. The government server returns data in a JSON format so we’ll parse the data after we retrieve it. First we’ll subset our dataset for expediency. This limits our waiting time during the workshop.
-
- expression =
value.slice(6,10)
- expression =
- select the “2014” facet
- select the “3 SEASON ROOM” facet
You should now have 6 matching rows.
API
Now let’s fetch the data from an API made available via the National Broadband Map. This API returns a FIPS code if we give it a county name (or in this case, even a partial county name.)
- fetch JSON data from the National Broadband Map. We’ll use the API documentation for Geography by Name API which returns Census geography for a geography name (e.g. Durham)
- Documentation
- The documentation informs us that the format of the URL we want to construct is as follows: http://www.broadbandmap.gov/broadbandmap/census/county/durh?format=json
- Notice the data values in the “county” column. All we do is construct a URL which calls the value of the cells from each row of the “country” column
- New column name =
JSON data - Throttle delay =
2000 - Expression =
'https://www.broadbandmap.gov/broadbandmap/census/county/'+value+'?format=json' - OK
- Wait for the results. If you limited to the matching rows in the select subset section this will only take a few seconds.
- Documentation
Parse
Now parse the value of the JSON data “fips” element; call the “fips” key when traversing the “county” objects from the Results set.
-
- New column name =
FIPS Code
- expression =
value.parseJson().Results.county[0].fips
- Note the square-bracket (
[0]) notation in theParseJson()function denotes and identifies the first array element. It’s the first element because in OpenRefine counting begins with zero (e.g. 0,1,2,3,4,5). The county array in the example below consists of only 1 value element (consisting of four, named key/value pairs; of which fips is one key). Since the JSON notation indicates county is an array, in this case of quantity 1, we identify that first element of the array by the number ‘0’. See the JSON example below
JSON Data Example
JSON 5 is JavaScript Object Notation a data wrapper. The API, in this case, returns the data in a JSON format.
{
  "status": "OK",
  "responseTime": 14,
  "message": [  ],
  "Results": {
    "county": [
      {
        "geographyType": "COUNTY2010",
        "stateFips": "37",
        "fips": "37063",
        "name": "Durham"
      }
    ]
  }
}
- New column name =
Original Data Source: Master Building Permit Data Set↩